How to use Windows 10 Task Manager to monitor system performance
Task Manager can help you to monitor your Windows 10 computer's performance in real-time, and here we show you how.
When something is not working correctly on your Windows 10 PC, the Task Manager is a tool that can provide valuable information about your system performance.
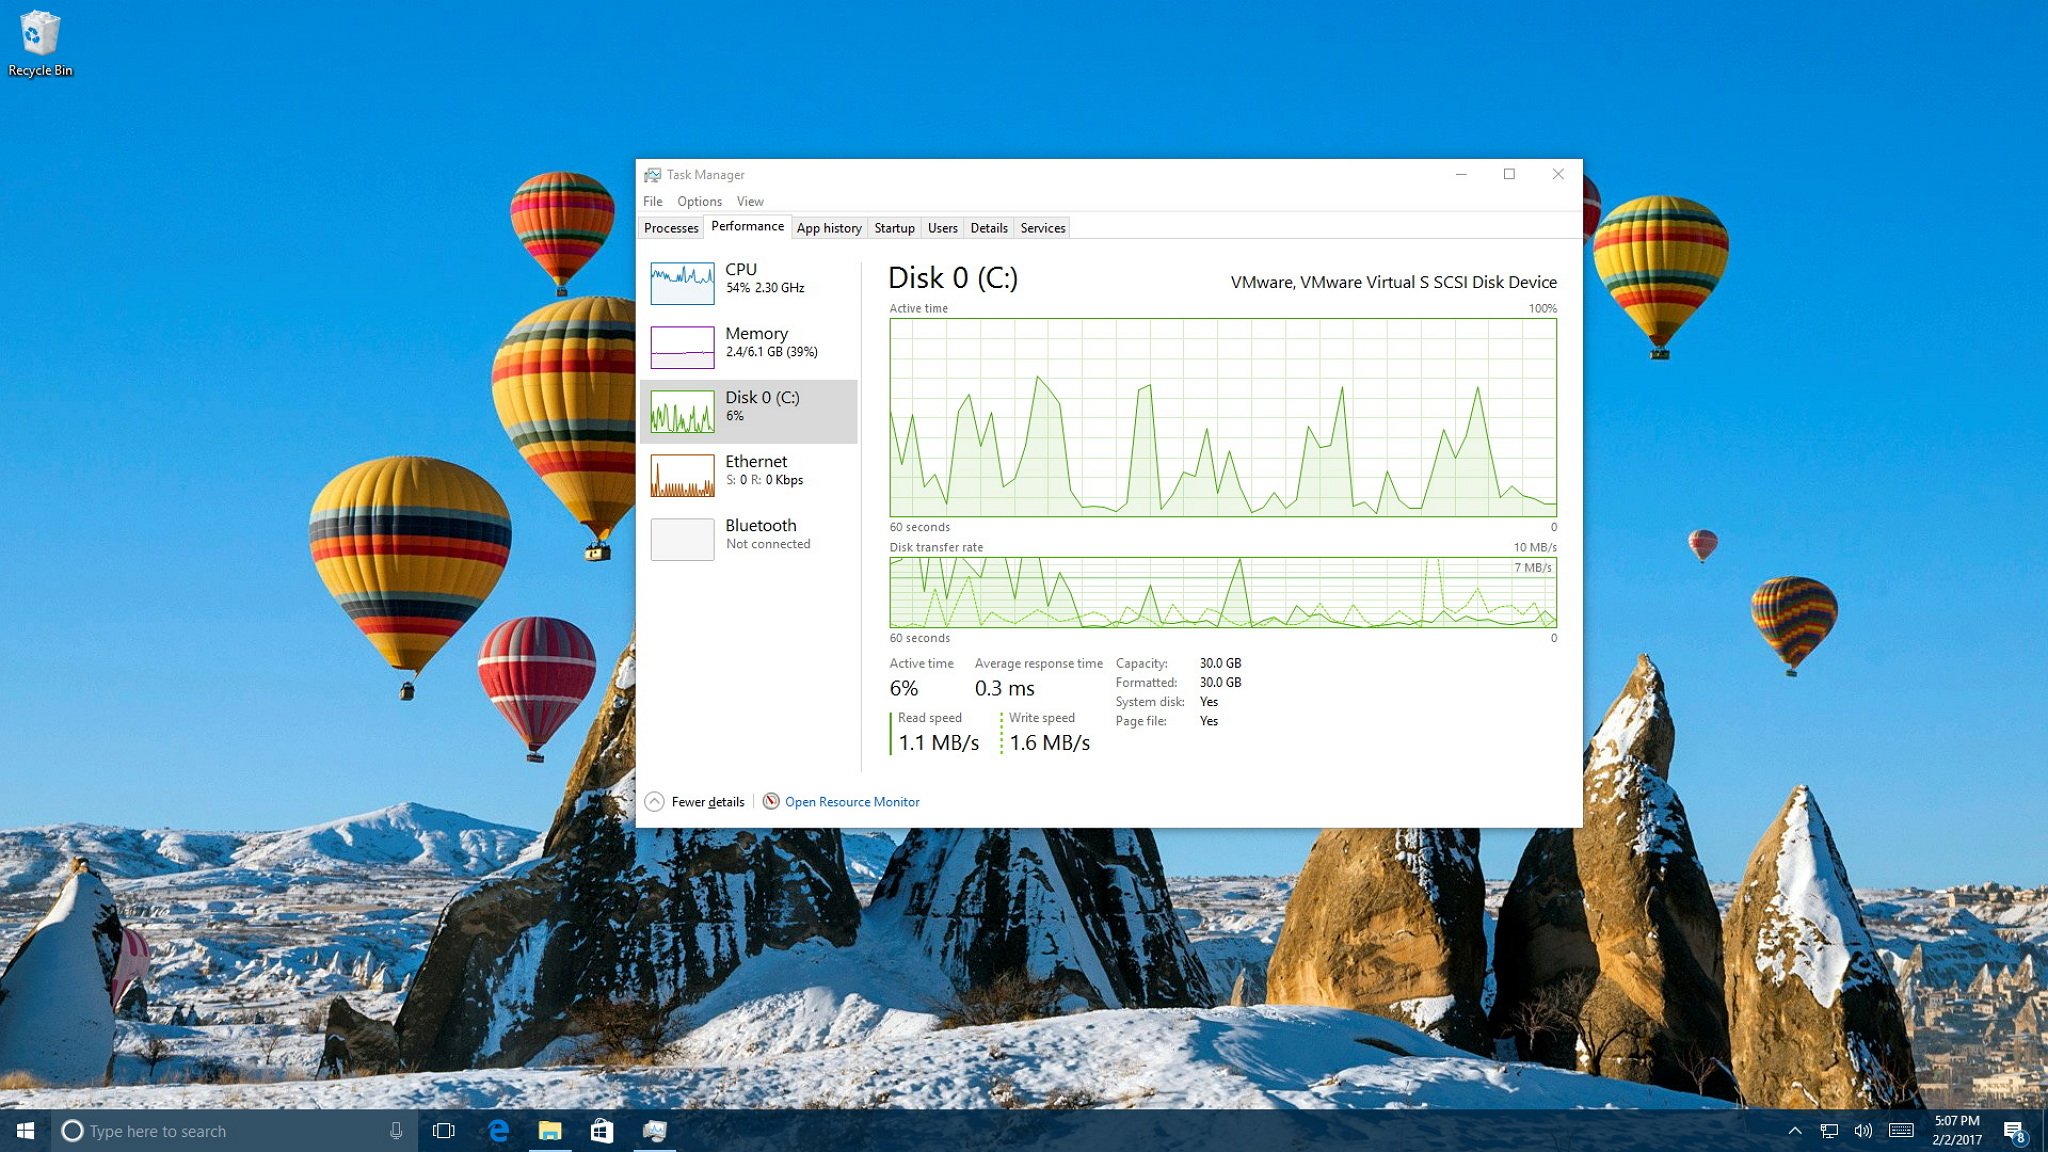
Although the Processes tab helps you troubleshoot applications and services running on your computer, you can use the Performance tab to get a real-time information of the performance on your computer, including CPU and memory usage, as well as hard drive, network, and Bluetooth information.
The ability to monitor your computer's performance in real-time can not only help you understand how resources are being utilized, but it's also useful information when trying to figure out the reason your device is not achieving expected network and hard drive speeds, among other issues.
In this Windows 10 guide, we'll walk you through the steps to use Task Manager to monitor the performance of your computer.
How to monitor your PC real-time performance
Opening Task Manager
On Windows 10, you can use Task Manager for an array of tasks, including to view real-time data on your computer's performance, but first, you need to know how to open the tool. Below are a few ways to open Task Manager:
- Right-click the Taskbar and click on Task Manager.
- Open Start, do a search for Task Manager and click the result.
- Use the Ctrl + Shift + Esc keyboard shortcut.
- Use the Ctrl + Alt + Del keyboard shortcut and click on Task Manager.
- Use the Windows key + X keyboard shortcut to open the power-user menu and click on Task Manager.
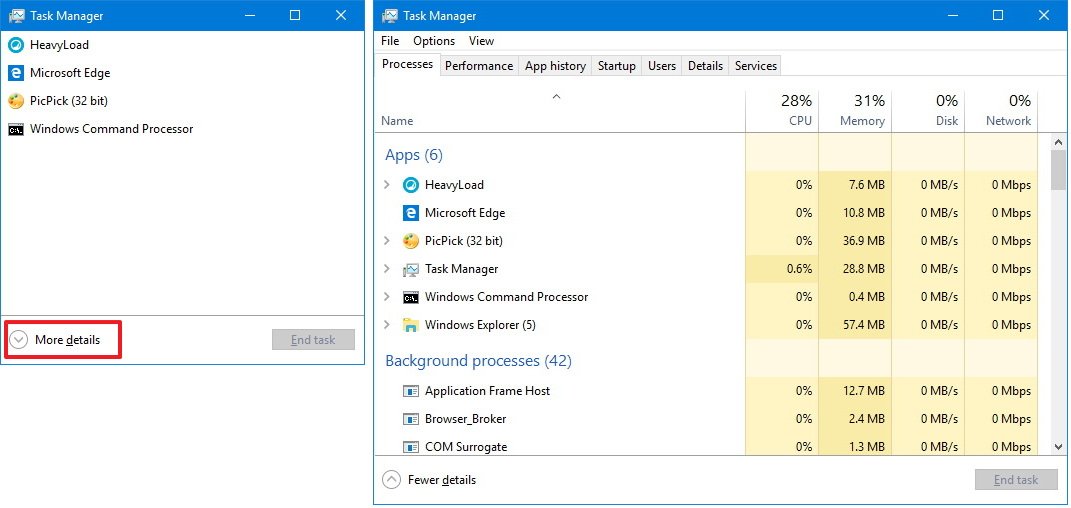
If you never open this tool before, you're likely to see Task Manager in compact mode. To get to Performance, you need to click the More details button, and then click on the Performance tab.
How to monitor system performance
In the Performance tab, you can monitor four main components, including processor, memory, hard drive, network (and Bluetooth).
Get the Windows Central Newsletter
All the latest news, reviews, and guides for Windows and Xbox diehards.
On the left pane by default, you'll see all the components with small graphs displaying their current activity in percentage for CPU, Memory, and Disk, and Kilobits per second for network adapters and Bluetooth devices providing visuals to quickly identify any spikes on resources.
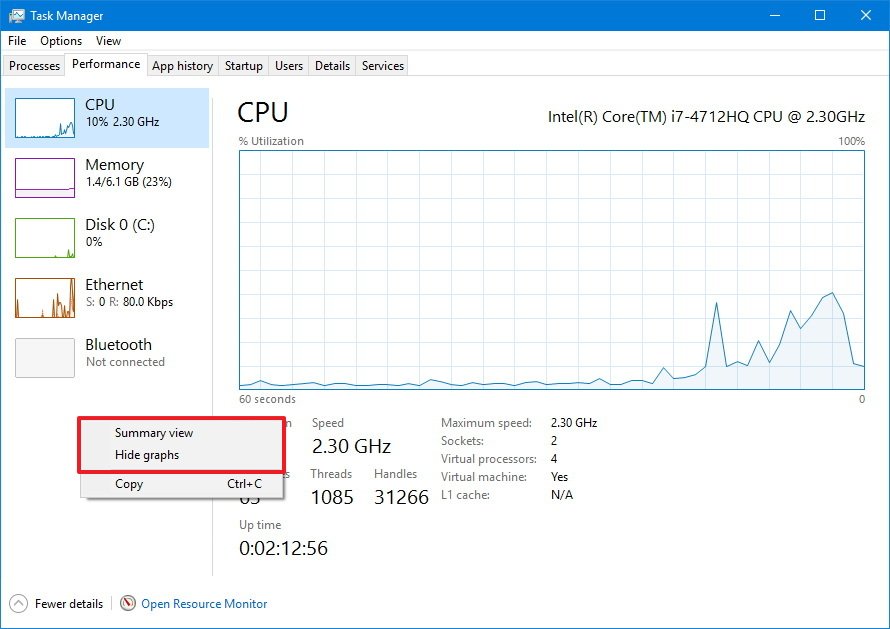
You can always right-click below the components to access the context menu to change the view and hide the graphs or only to show a summary, which can come in handy if you want to keep Task Manager open at all times.
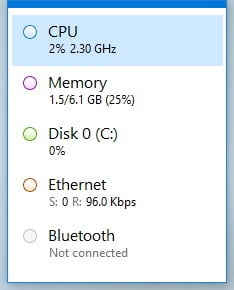
Also, in any section, you can double-click or right-click a graph and select Graph summary view to see only a compact graph with the component activity information.
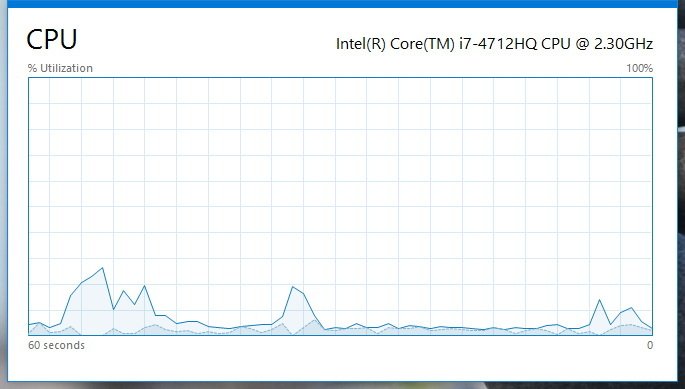
Quick Tip: If you need to document any information, instead of taking a screenshot, you can right-click anywhere in a section and click Copy from the context menu. Then simply paste the information in a text file for later use.
Here's the breakdown of each section in the Performance tab:
CPU
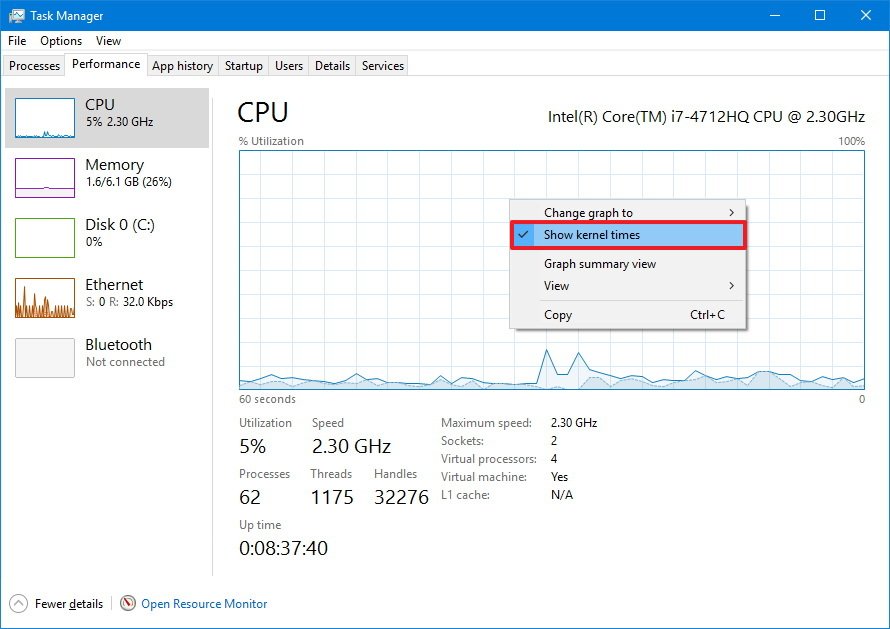
The CPU section provides details about the processor and resource utilization. In the top-right corner you'll see exactly which processor your computer is using and the clock speed it was designed to run.
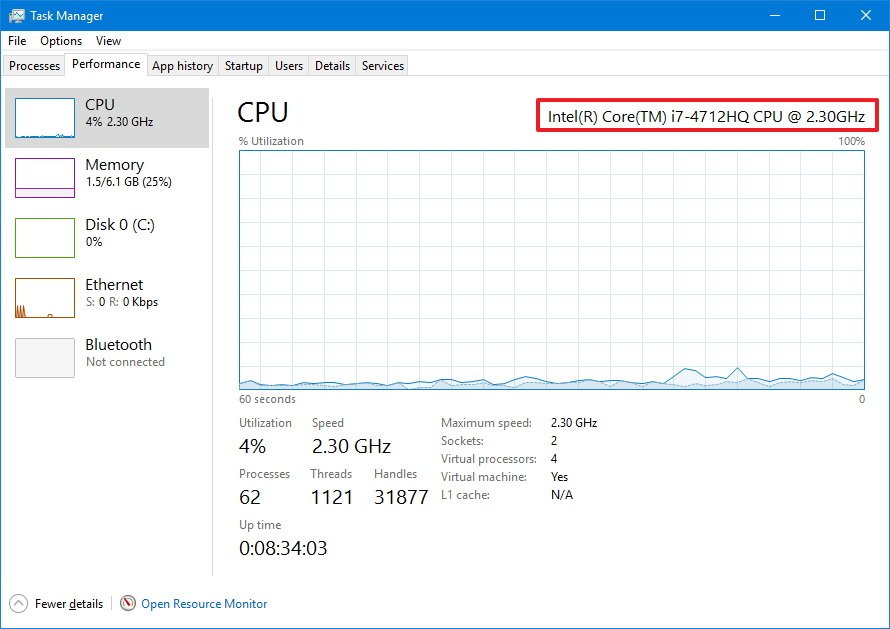
The graph shows the overall utilization of the processor over a 60 second period. In addition, you can right-click anywhere inside the section, select Change graph to, and click Logical processors to view a graph for each core of your processor.
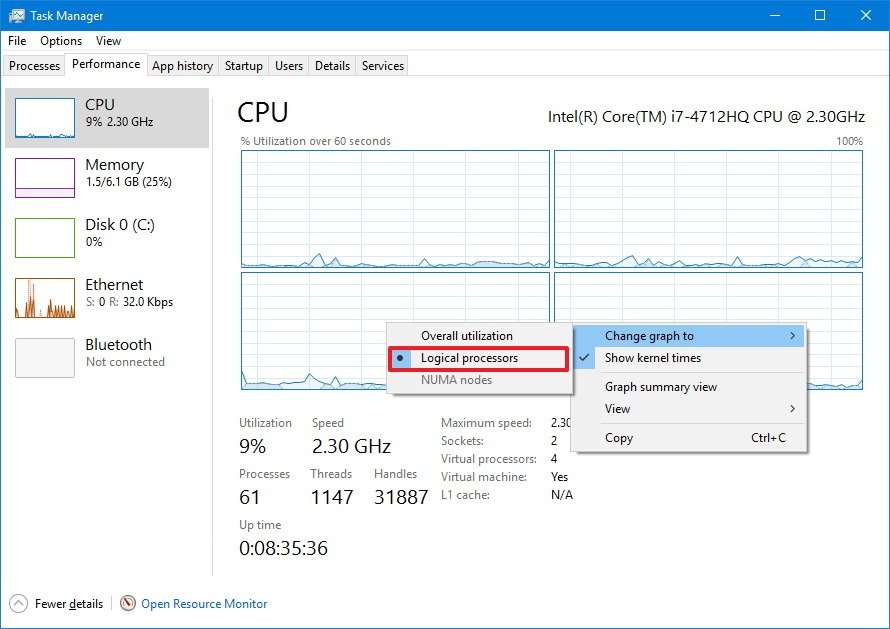
The context menu also offers an option to show kernel times, which you would typically use to troubleshoot devices with poorly written drivers or failing hardware that is causing too many interruptions.
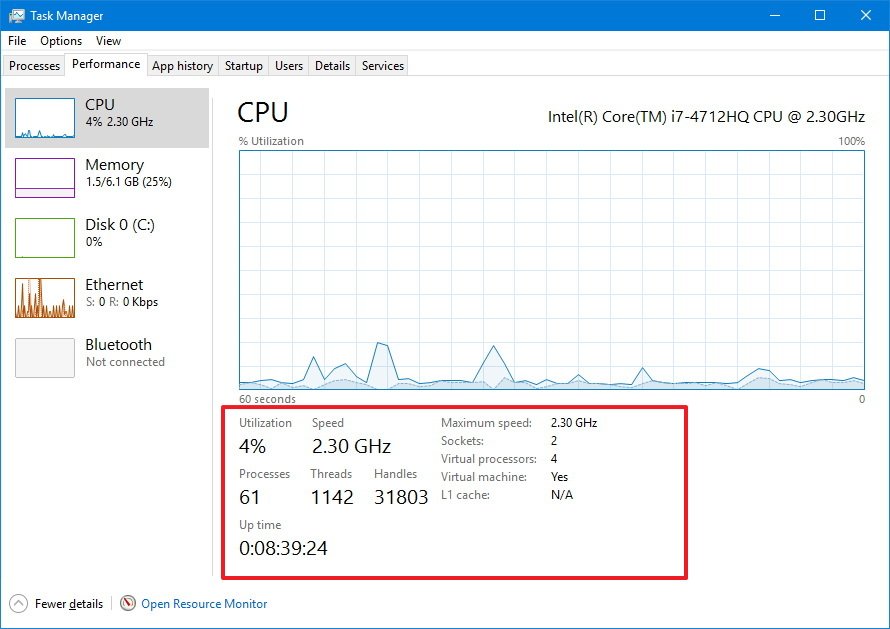
At the bottom, you'll see more details about the processor resources, including percentage utilization, processes, threads, handles, and your computer up time.
On the right, you can see the processor specifications, such as speed, the number of cores (virtual processors), if it's capable to run virtual machines, and cached memory information if applicable.
Memory
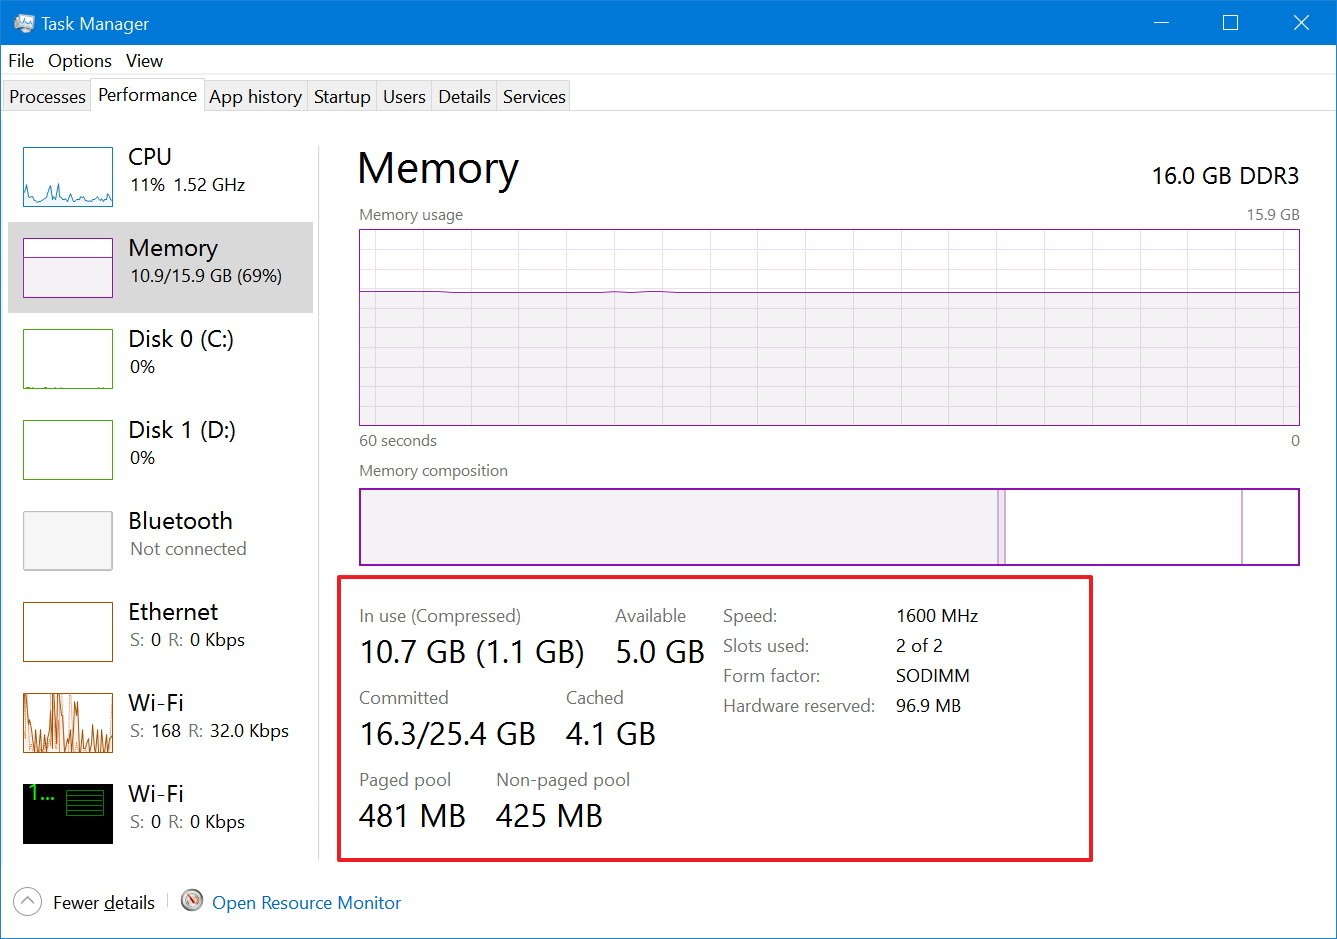
Memory offers a view of the RAM usage by the system and applications. In the top-right corner, you'll see total amount and type (e.g. DDR3) of memory installed on your device.
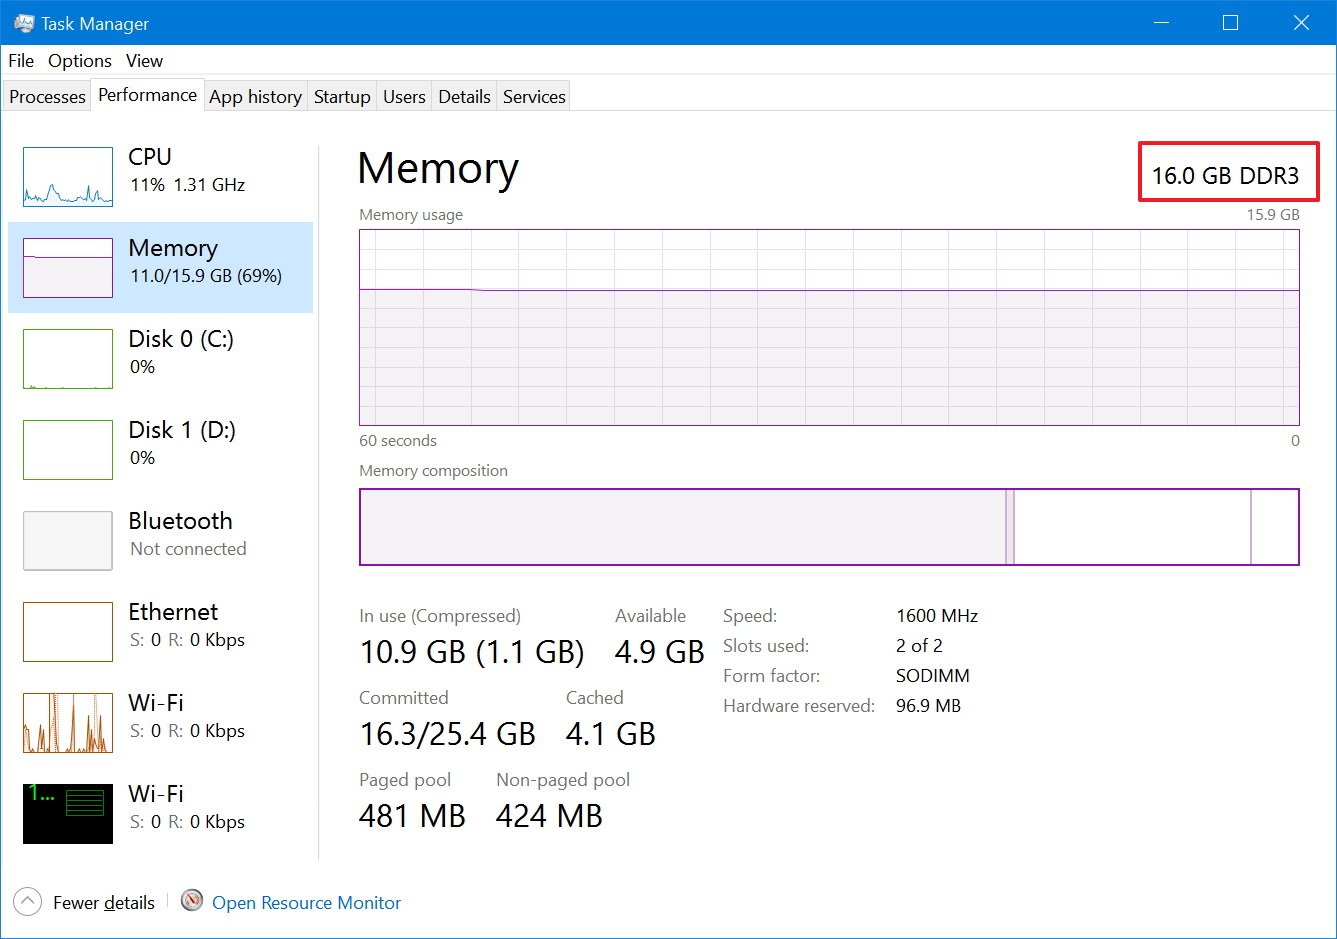
In this section, you'll notice that there are two graphs. The first one on the top shows total memory usage over a 60 second period, and the graph below shows the amount of memory is currently allocated.
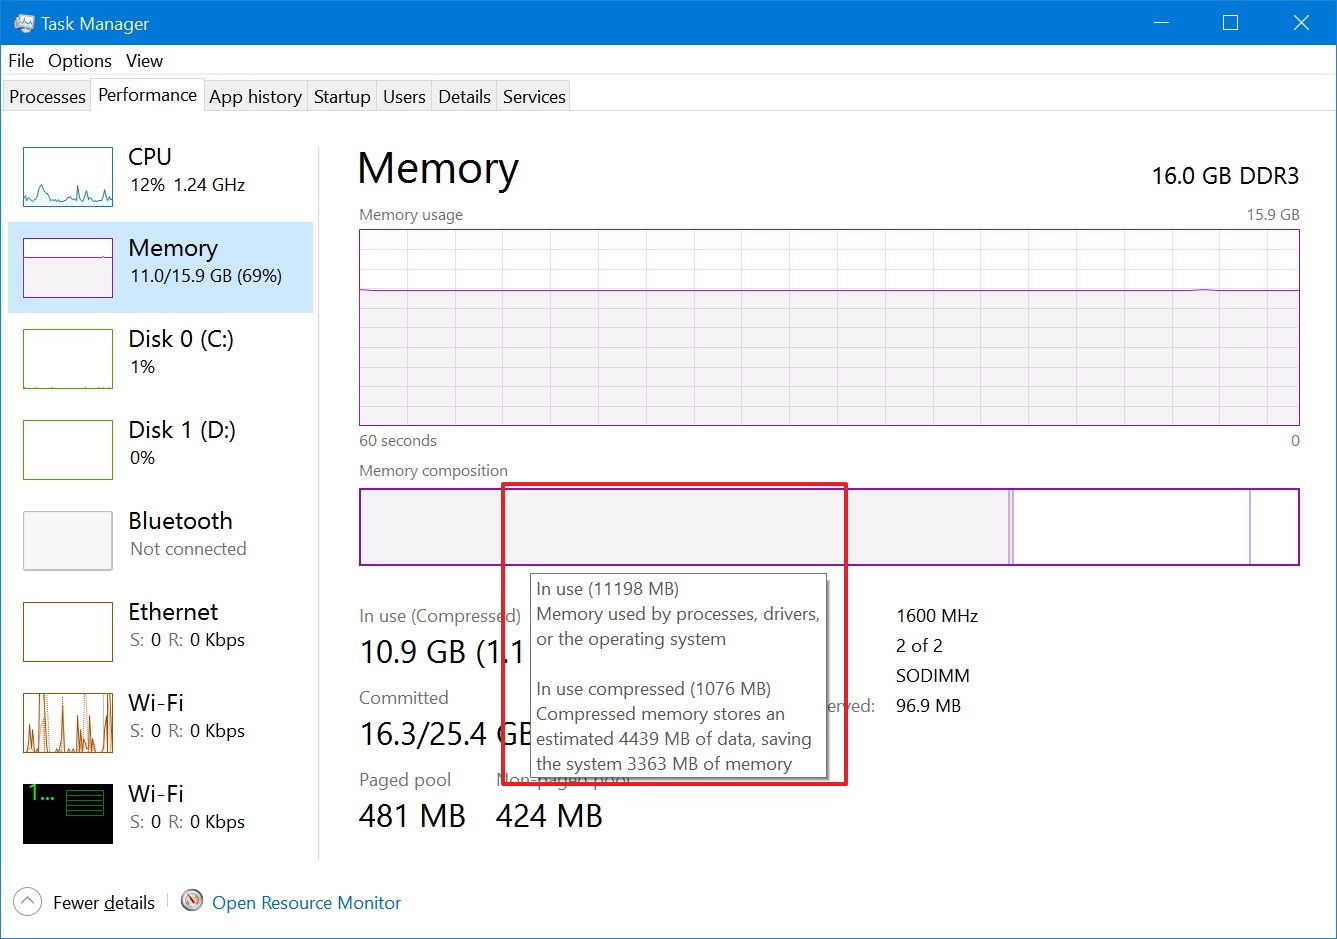
The memory composition has four parts:
- In use (Compressed): Amount of RAM currently being used by applications, drivers, or the operating system.
- Modified: Memory content that has to be saved to the hard drive before it can be used for something else.
- Standby: Amount of memory that contains cached data and code not being used by the system.
- Free: Shows memory currently not in use.
You can always see these details by hovering with the mouse over each section of the graph.
At the bottom, you'll also find detailed information about your computer's memory usage, including "In use (Compressed)," "Committed," "Cached," "paged pool" and "non-paged pool" memory.
On the right, you can also see memory specifications, such as speed (e.g. 1600MHz), slots available, memory form factor (e.g. SODIMM), and memory reserved for hardware on the right side. The details provided on this page not only give you an overview of memory usage in real-time, but you can use this information at the time you need to upgrade your system.
For example, the "Slots used," tells you whether or not your computer have slots available to add more memory. "Speed," "Form Factor," and memory type are important information at the time to purchase the correct memory sticks to upgrade your computer.
Disk
The Disk section provides important information about hard drive usage. Task Manager doesn't group multiple hard drives into a single view, which means that you'll get a Disk section for each hard drive installed on your computer.
On the top-right corner, you'll see exactly the hard drive your computer is using, the interface type (e.g. mSATA), and capacity in Gigabytes.
This section includes two graphs. The first graph from the top shows you the hard drive activity over a 60 second period. The second graph shows you the transfer speeds in Kilobytes per second over a 60 second period.
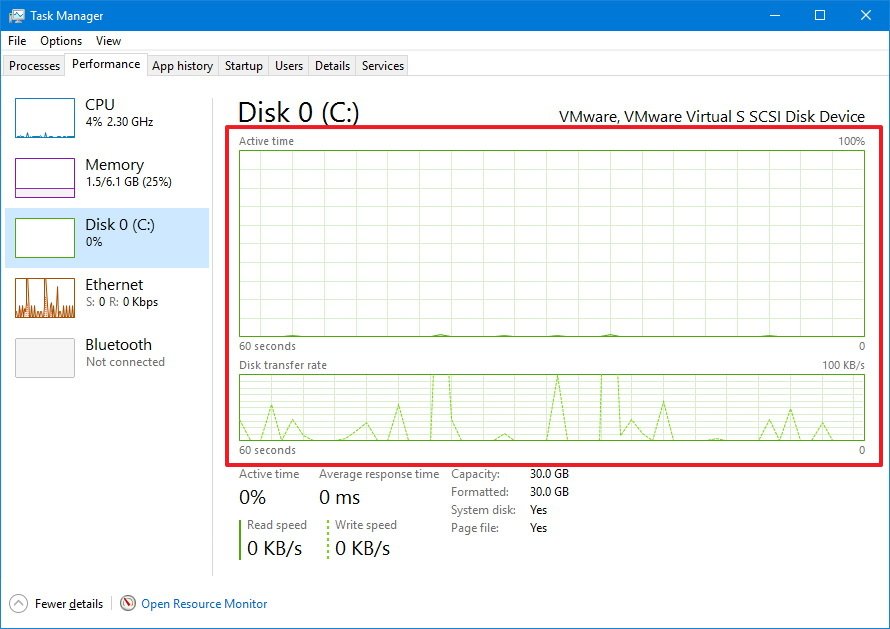
At the bottom of the section, you'll also find detailed information, including the percentage of drive active time, the average speed that it takes the hard drive to respond to a request, and read and writes speeds.
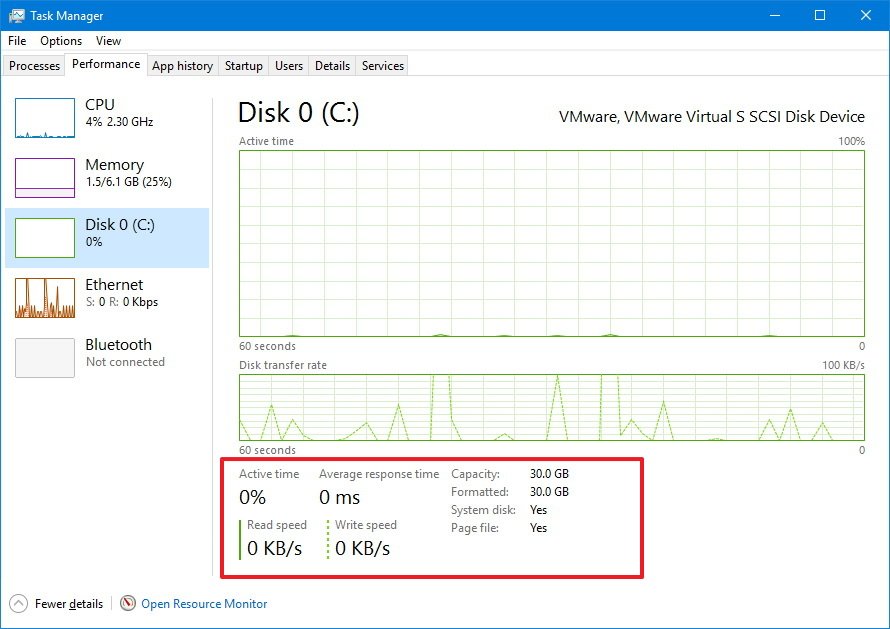
Additionally, you get information on actual usable capacity after the drive is formatted, and "System disk" display whether the drive is where Windows 10 is installed, or if it's a secondary drive.
Ethernet/Wi-Fi
Task Manager doesn't group multiple network adapters into a single view, which means that you'll get a section for each Ethernet or Wi-Fi adapter installed on your computer. Even virtual network adapters will list separately.
When you select a network adapter, you'll notice the name of your Wi-Fi or Ethernet adapter in the top-right corner.
There is only one graph in this section that shows you the throughput of the adapter over a 60 second period.
Below the main graph, you also get information about data sent and received in Kilobits per second. Additional details include adapter name, connection type, and your current IPv4 and IPv6 addresses.
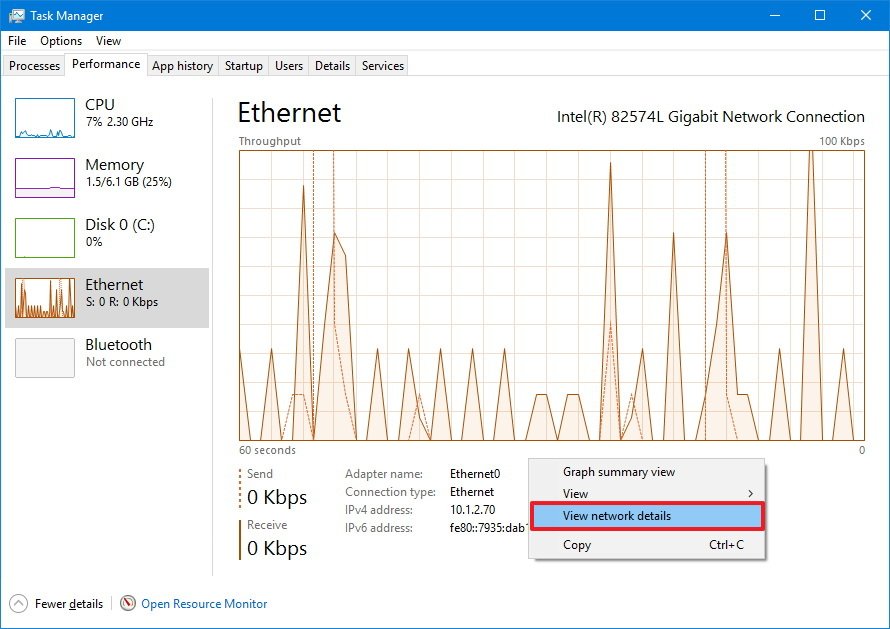
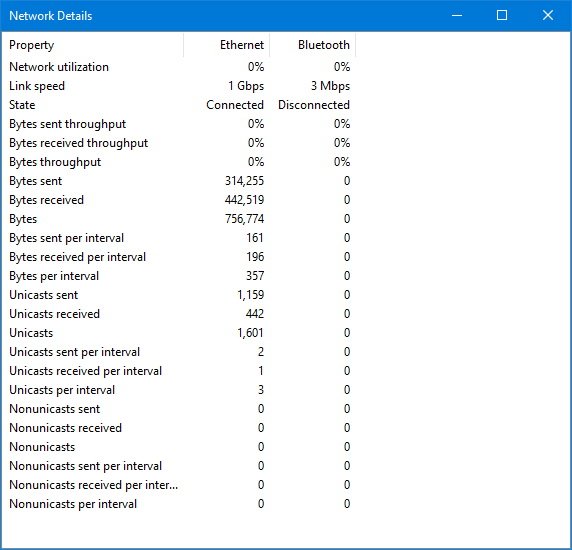
Advanced users can also right-click the graph and select "View network details" to see more network details that can help troubleshoot network problems, such as link speed, state, bytes generated, sent and received, along with unicast packets information.
Bluetooth
In the Performance tab, you'll also notice that there is a Bluetooth section, which is probably showing as "Not connected," even though you have connected a Bluetooth device to your computer. The reason is that this is actually a network adapter, and it's not meant for peripherals like speakers, keyboard, and mouse.
You will see additional information in the Bluetooth section when you connect your phone or another device, and you begin transferring data.
Wrapping things up
As you can see the Performance tab provides great information on how your computer's hardware is performing with easy to understand graphs and important system and hardware details. This information can be very useful not only to understand how resources are being utilized but to troubleshoot many problems as well.
More Windows 10 resources
For more help articles, coverage, and answers on Windows 10, you can visit the following resources:
- Windows 10 on Windows Central – All you need to know
- Windows 10 help, tips, and tricks
- Windows 10 forums on Windows Central
Mauro Huculak has been a Windows How-To Expert contributor for WindowsCentral.com for nearly a decade and has over 15 years of experience writing comprehensive guides. He also has an IT background and has achieved different professional certifications from Microsoft, Cisco, VMware, and CompTIA. He has been recognized as a Microsoft MVP for many years.

