How to open and analyze crash dump files on Windows 10
If a device keeps crashing, the dump file may contain details on how to solve the problem, and here's how to open it on Windows 10.
All the latest news, reviews, and guides for Windows and Xbox diehards.
You are now subscribed
Your newsletter sign-up was successful
Join the club
Get full access to premium articles, exclusive features and a growing list of member rewards.
On Windows 10, when there is a crash, the system creates a "dump" file containing the memory information at the time of the error, which can help determine the reason for the problem.
The ".dmp" file includes the stop error message, a list of the drivers loaded at the time of the problem, kernel, processor, and process details, as well as other information depending on the type of dump file you have.
Although Windows 10 automatically creates dump files, the only problem is that you won't find any built-in tools to open this type of file, and this is when the Microsoft Windows Debugging (WinDbg) tool can help. WinDbg is an advanced tool designed for debugging kernel-mode and user-mode code, reviewing processor registries, and analyzing crash dumps.
Article continues belowThis guide will walk you through the steps to open a dump file to determine what caused the crash to resolve the problem on your computer.
How to open dump file with WinDbg on Windows 10
On Windows 10, you may find multiple ways to open and review a dump error file, but the easiest way is to use the WinDbg tool available through the Microsoft Store.
Install WinDbg
To install the WinDbg tool on Windows 10, use these steps:
All the latest news, reviews, and guides for Windows and Xbox diehards.
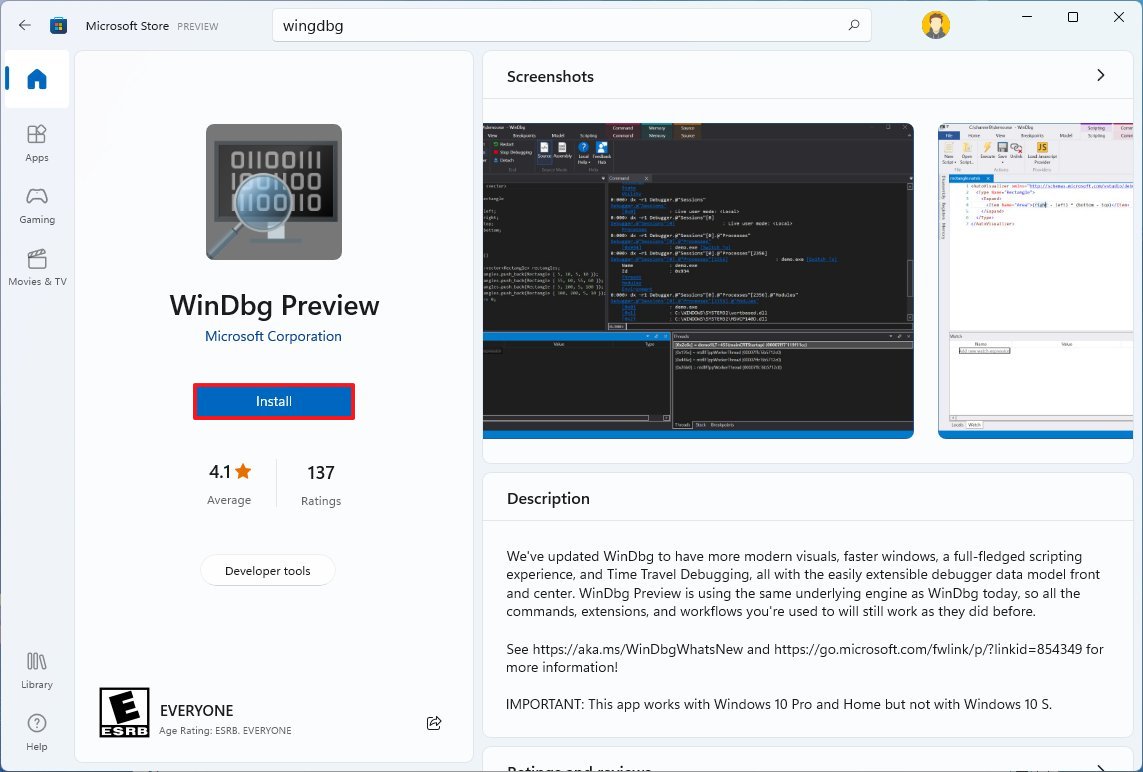
- Open the WinDbg download page.
- Click the Install button.
- Click the Open button.
- Click the Install button.
Once you complete the steps, the application will install, and it will be available through the Start menu.
Analyze dump file
To open and analyze a dump file created by a crash on Windows 10, use these steps:
- Open Start.
- Search for WinDbg, right-click the top result, and select the Run as administrator option.
- Click the File menu.
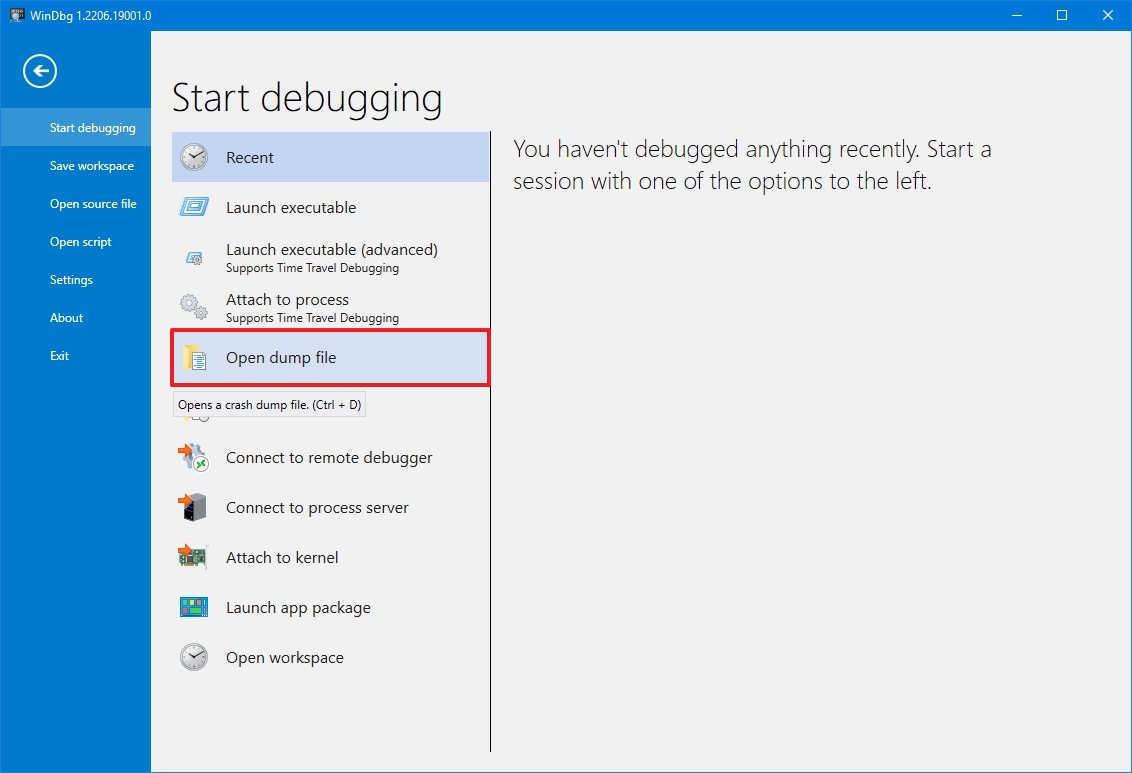
- Click on Start debugging.
- Select the Open sump file option.
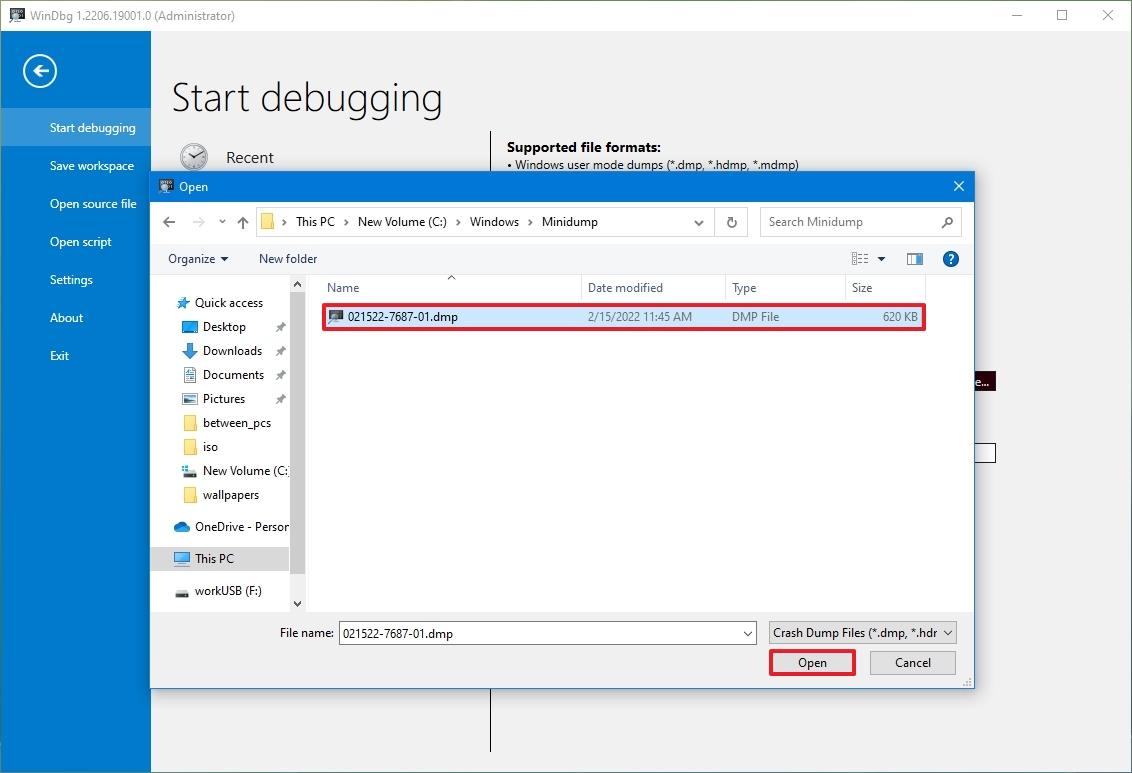
- Select the dump file from the folder location — for example, %SystemRoot%\Minidump.
- Click the Open button.
- Click the Open button again.
- Check the progress bar until it loads the dump file (this may take a while).
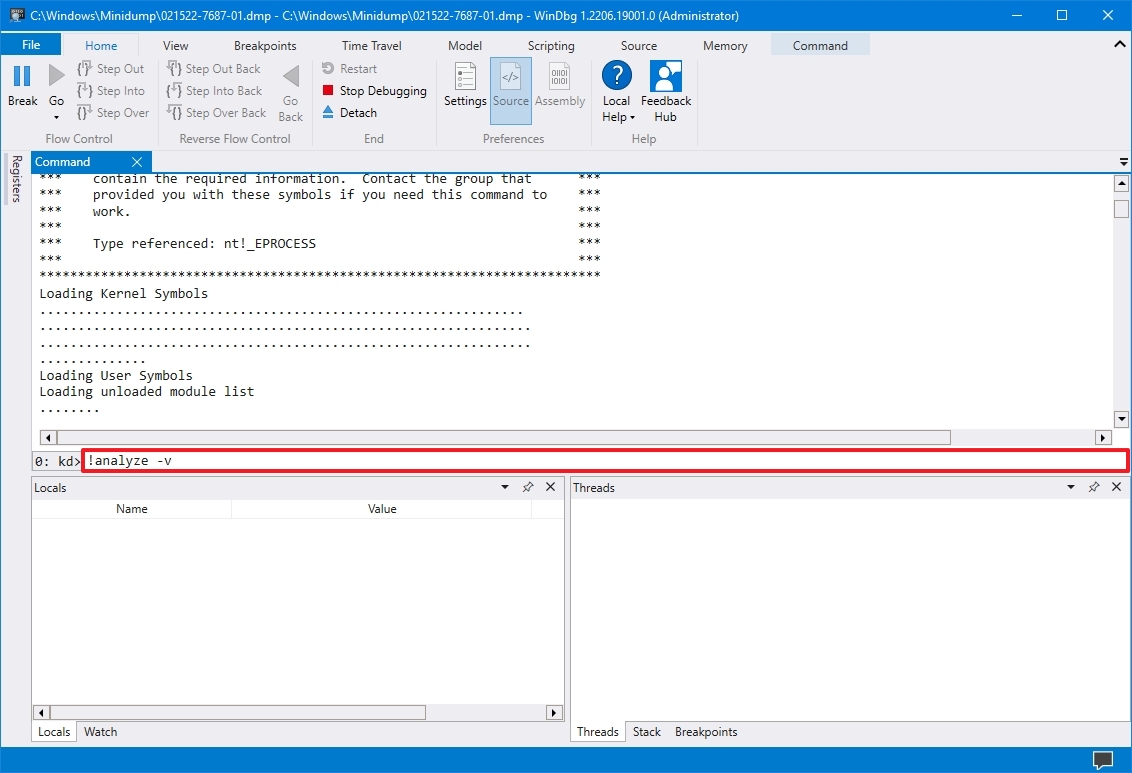
- Type the following command in the run command and press Enter: !analyze -v
- Quick tip: You can also click the !analyze -v link if available from the main area if available after loading the dump file.
- Check the progress bar until the analysis is complete (this may take a long time depending on the data size).
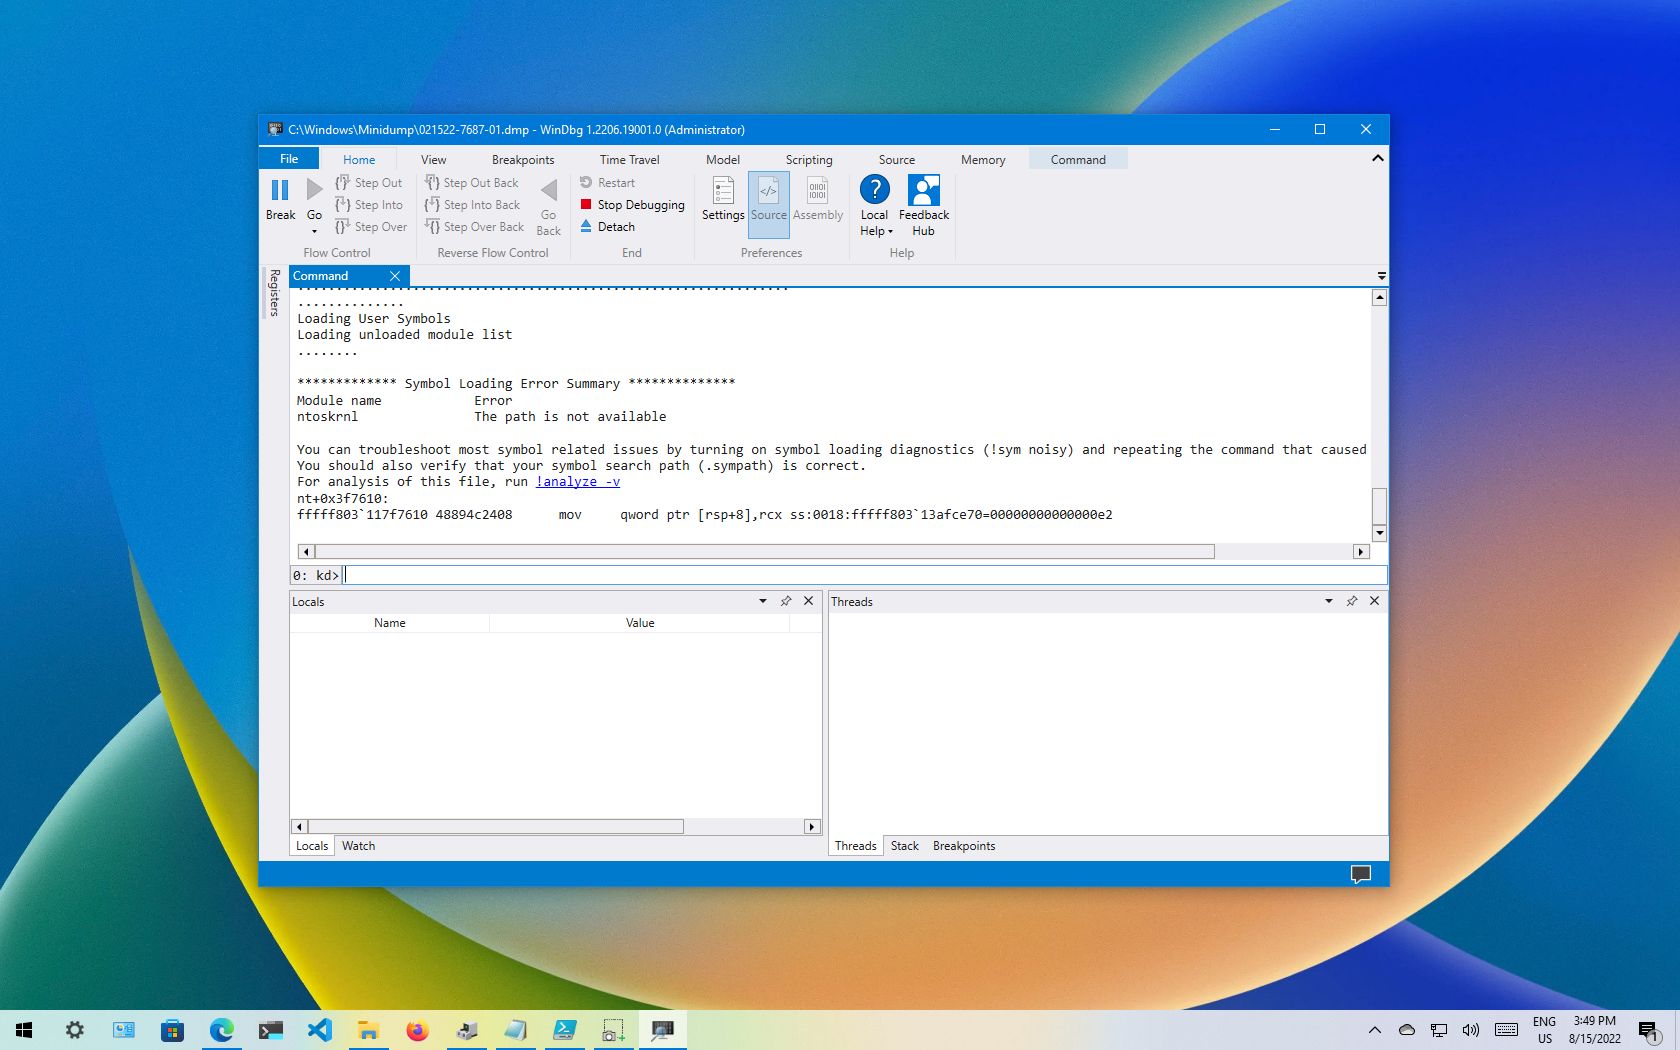
After you complete the steps, the application will return the dump file analyses, which you can then review to determine the reason for the problem to help you resolve the issue.
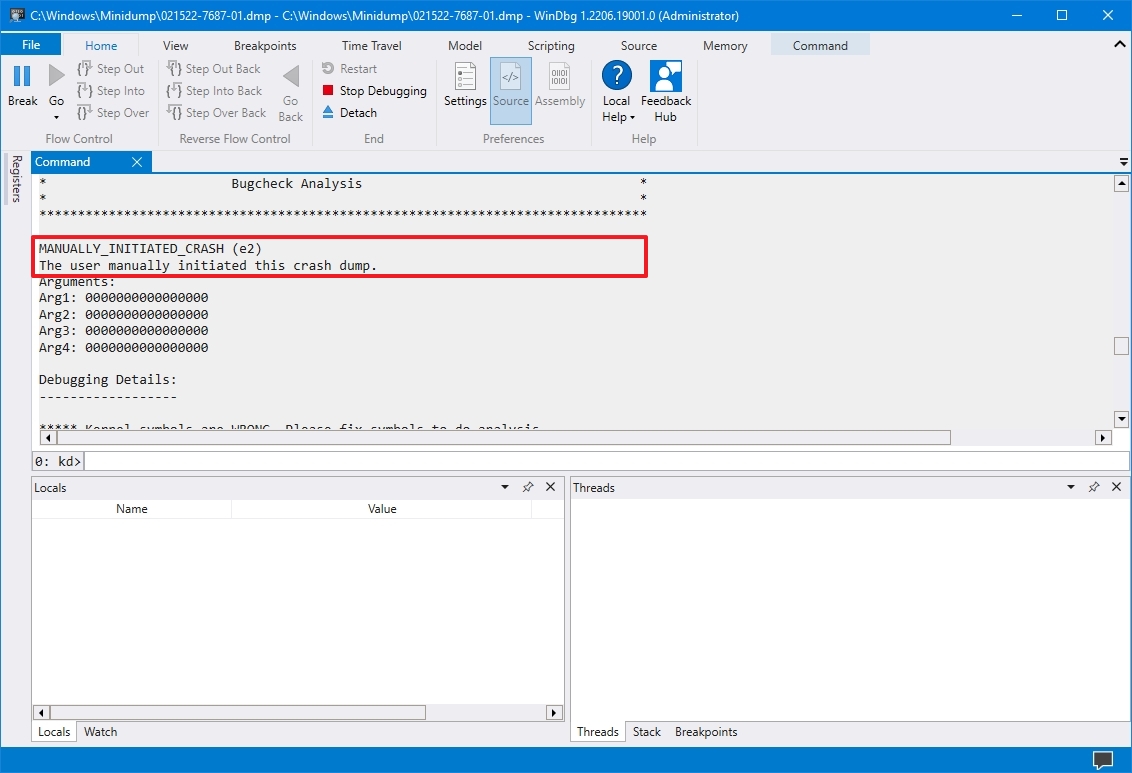
The information will be different depending on the problem. For example, this result points out that this was a manually initiated crash with an "e2" error code, which is correct since, for this guide, we use these instructions to force a dump file. The WinDbg even makes an excellent job describing the crash in a language anyone can understand ("The user manually initiated this crash dump").
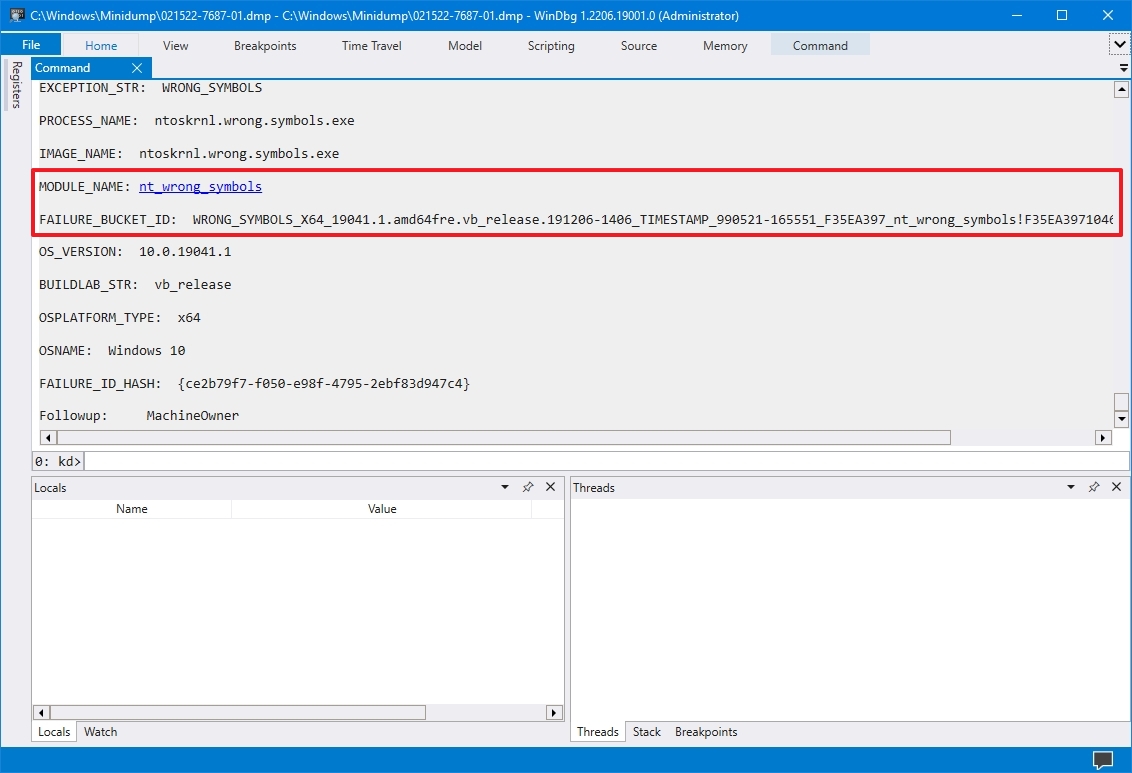
As you continue reviewing the dump file, you will also find more information, such as "FAILURE_BUCKET_ID" and "MODULE_NAME," which could indicate what is causing the problem.
The information can be overwhelming since it is not meant for regular users. If your computer keeps crashing, you can use this tool to get an idea of the problem. If you cannot figure it out, you can use the hints in the report to search online for more information.
More resources
For more helpful articles, coverage, and answers to common questions about Windows 10 and Windows 11, visit the following resources:

Mauro Huculak has been a Windows How-To Expert contributor for WindowsCentral.com for nearly a decade and has over 22 years of combined experience in IT and technical writing. He holds various professional certifications from Microsoft, Cisco, VMware, and CompTIA and has been recognized as a Microsoft MVP for many years.
 Join The Club


